

OpenData V12.0---Large-scale Traffic Speed Data Set
1. Data Description
This traffic speed data set is comprised of 214 anonymous road segments (mainly consist of urban expressways and arterials) from Aug. 1, 2016 to Sep. 30, 2016 at 10-minute interval in Guangzhou, China. It is available for everybody without any commercial use. Relying on this data set, if you plan to do some studies, please clarify the data sources and cite the OpenITS.
2. File Description
speeddata.csv - the traffic speed dataset (contains 1855589 speed records).
(1) road_id: a unique anonymous identifier for each road segment (see the first column of Fig. 1). As an example, 1 indicates the first road segment;
(2) day_id: a unique code indicating the date (see the second column of Fig. 1). In this column, 1 represents Aug. 1, 2016, 2 represents Aug. 2, 2016, as such, 61 represents Sep. 30, 2016;
(3) time_id: a unique code indicating the time windows (see the third column of Fig. 1). For example, 1 represents 00:00:00-00:10:00, 2 represents 00:10:00-00:20:00;
(4) speed: the speed values with unit km/h (see the last column of Fig. 1).
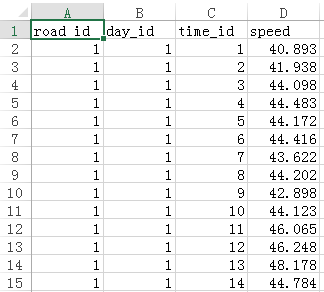
Fig. 1. The screenshot of speeddata.csv with its first 14 rows
tensor.mat - the three-dimensional array (see Fig. 2) with size along first dimension is 214 (i.e., 214 road segments), size along second dimension is 61 (i.e., 61 days from Aug. 1, 2016 to Sep. 30, 2016), size along third dimension is 144 (i.e., 144 10-minute time window during each day), and its entries indicate traffic speed. This file is converted by speeddata.csv, and it can be directly loaded in MATLAB as shown in Fig. 2.
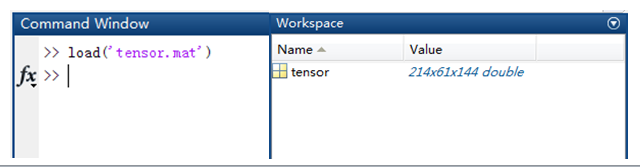
Fig. 2. The screenshot of workspace in the MATLAB where tensor.mat has been loaded using the command “load(‘tensor.mat’)”
3. Case
Here, relying on this large-scale (or city-wide) traffic speed data set, some interesting experiments such as missing data recovery and traffic patterns discovery could be conducted. In the submitted article (“Spatial-temporal traffic speed patterns discovery and incomplete data recovery via SVD-combined tensor decomposition” accepted by Transportation Research Part C), based on tensor decomposition, the task of discovering traffic patterns from partially observed data as shown in Fig. 3 and further using these patterns to recover the missing data accurately has been achieved.

Fig. 3. The random missing along road segment and day dimensions where the white squares imply missing data. From left to right, the missing rate is increased from 20% to 80% (step is 10%).
As for traffic pattern discovery, we can observe from Fig. 4 that the traffic pattern during weekend (such as August 6th, August 7th, August 13th, August 14th, August 20th, and August 21st.) has been discovered. In particular, the traffic pattern during three-day holiday (the traditional Middle-Autumn festival in China) from September 15 to September 17, 2016 has been automatically categorized into the weekend.
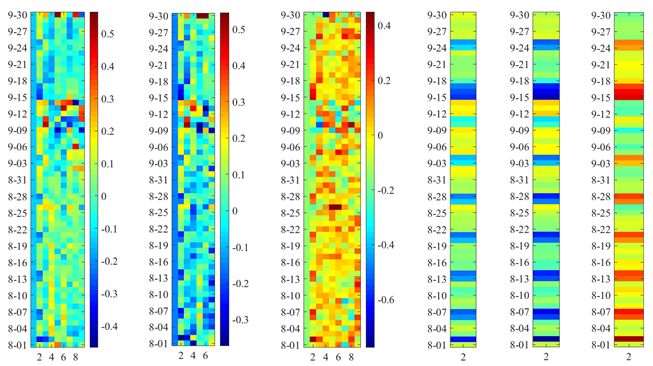
Fig. 4. The visualization of decomposed factor matrix along day dimension, from left to right, the first three heat maps are trained by the 30%, 50% and 70% missing, respectively. Notably, the right three heat maps are the second column of left three heat maps. Under different missing rates, the similar trend is obtained by the tensor decomposition model.
As for the missing data recovery, a road segment (first road segment labeled in the speeddata.csv) is selected, its speed observations from Aug. 1, 2016 to Aug. 7, 2016 is plotted with black line, and the missing areas are also illustrated. As can be seen by red lines, the estimated speed values is really approximate to the actual ones. Even for the heavy missing such as 70%, there are speed observations along four days are completely lost, the tensor decomposition model is able to recover the missing data accurately.

(a) Missing rate is 30%

(b) Missing rate is 70%
Fig. 5. The estimated speed and corresponding actual values of a road segment, note that the missing area (gray area) represents the complete missing along a day.
OpenData V12.0---路网车速数据集
1. 数据描述
数据集是广州214条匿名路段(主要是主干路和快速路)、时间跨度为两个月(2016年8月1日至2016年9月30日)的实测车速数据,其中,时间窗为10分钟。
2. 数据集说明
speeddata.csv - 车速数据集(包含1855589条车速记录,前14条如图1所示)。
(1) road_id:路段的编号,例如,图1中第一列的“1”即表示第1条路段;
(2) day_id:天的编号,其中,数字“1”表示2016-08-01,数字“2”表示2016-08-02,以此类推,数字“61”表示2016-09-30;
(3) time_id:时间窗的编号,其中,数字“1”表示00:00:00-00:10:00,数字“2”表示00:10:00-00:20:00;
(4)speed:车速值(单位为km/h)。

图1 speeddata.csv的部分截图
tensor.mat - 三维数组,第一个维度大小为214(即对应着214条路段),第二个维度大小为61(即对应着61天,2016-08-01至2016-09-30),第三个维度大小为144(即对应着一天的144个时间窗)。该数组文件是由speeddata.csv整理得到的,如图2所示,可直接加载到Matlab进行分析。
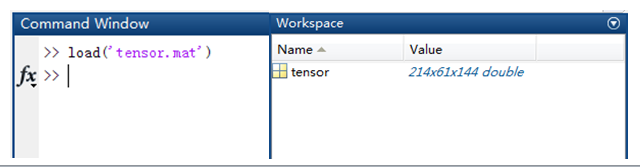
图2 在MATLAB的Command Window输入程序“load(‘tensor.mat’)”即可在workspace上看到大小为214-61-144的三维数组
3. 数据应用
基于本次开放的大规模路网车速数据,中山大学硕士研究生陈新宇与其导师何兆成教授在Transportation Research Part C上发表了论文《Spatial-temporal traffic speed patterns discovery and incomplete data recovery via SVD-combined tensor decomposition》。该研究旨在从部分观测数据(如图3)中挖掘隐性的交通模式,并进而利用这些模式准确地估计缺失数据。
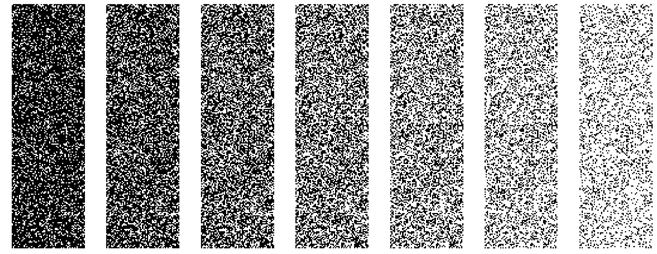
图3 使车速数据在路段和天两个维度进行随机地缺失,其中,白色小方块表示缺失数据,从左到右,缺失率以10%为间隔从20%到80%增加。
就模式挖掘而言,如图4,右侧的三张热图反映了非工作日的交通模式,其中,深色区域依次对应着8月6日、8月7日、8月13日、8月14日、8月20日、8月21日等,另外,中秋三天假(9月15日、9月16日、9月17日)也被自动归为非工作日。

图4 张量分解模型中“天”这一维所对应的因子矩阵可视化效果,从左到右,前三张热图分别对应着30%、50%和70%的缺失率,右侧三张热图是前三张热图的第二列。尽管缺失率不同,但右侧三张热图具有相似的趋势。
就缺失数据填补而言,这里选了一条路段(即speeddata.csv中被编号为1的路段)从8月1日至8月7日的车速数据为例,图5中,黑线表示真实车速,红线表示所提出方法的估计车速,灰色区域表示数据缺失。当缺失率为30%时,该条路段在这七天中随机缺失了8月2日一整天的车速数据,所提出方法能够相对准确地估计出缺失数据;当缺失率为70%时,该条路段这七天随机缺失了四天的车速数据,可以发现,所提出方法依然能够很好地估计出缺失数据。
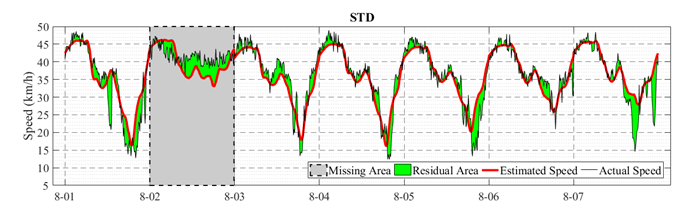
(a) 整体缺失率为30%
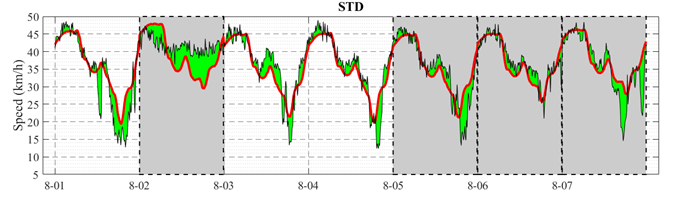
(b) 整体缺失率为70%
图5 第一条路段在8月1日至8月7日的车速数据及其估计值,其中,灰色区域表示数据缺失。
引文格式(Citation Reference):
数据集:

注 :下载数据后解压时请使用除winRAR以外的解压工具进行解压